http://www.bikejames.com/strength/are-you-false-fit-3/ (for above image)
Understanding Kinematic Variables
Whether it is velocity, time, acceleration, or displacement; kinematic variables all have relationships. Various equations are used to solve for an unknown based on ones that are given. Forces are not considered in kinematics which limits the amount of information that can be provided. For example, kinematics in mountain biking does not consider forces of being able to pedal at certain cadence, energy transformation, and momentum which is significant factor in mountain biking and can be used to an advantage. Since this topic in physics does not cover a substantial amount of information,
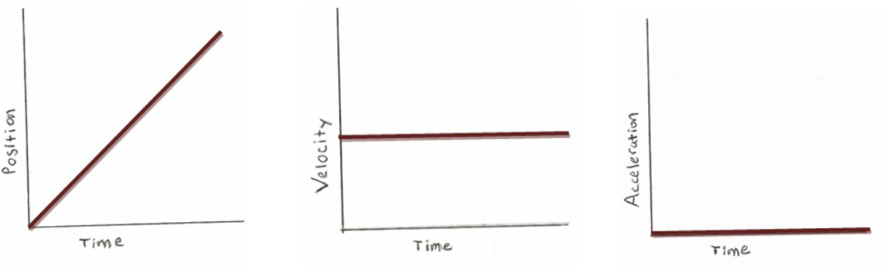
Graphs of a Bike traveling at a constant velocity
As you can see, the position of the rider is steadily getting further away from the reference point. The relationship displayed in the position/time graph is linear because the velocity is constant which means the position/time increases by the same factor. Velocity is constant as demonstrated by the velocity time graph and because of this, there is no acceleration as displayed in the acceleration/time graph.
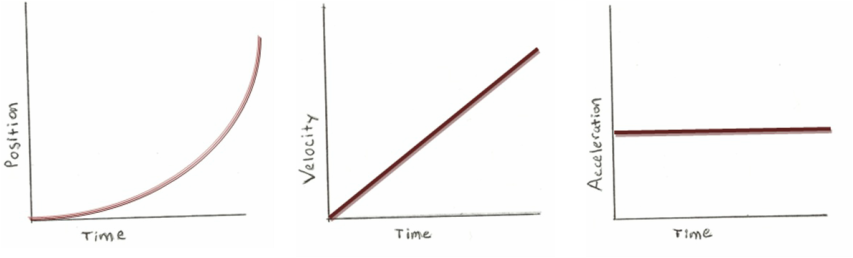
Graphs of a bike accelerating in uniform motion
As you can see, the position of the rider from zero time is slowly moving away from the reference point. Going further into the duration of time, you see that the curve in the position/time graph gets steeper. This is because the velocity is increasing as displayed in the velocity time/graph which means the position from the reference point is going to be further away in a smaller amount of time. Since there is change in velocity, this means that there is acceleration exemplified by the acceleration/time graph.
Strategy in mountain biking
Winning any race always has to do with the competitor who can do it in the shortest amount of time. For this to happen, you need to be efficient and maintain a high average velocity. For example, a 10 kilometer race with frequent changes in terrain and slope of hills valleys requires the use of all gear ratios to be more efficient and ultimately achieve the fastest time. Analyzing stages of race can effectively plan out how you’re going to choose your racing strategy (high/low gear ratio, high/low pedaling cadence). A basic scenario to help demonstrate how this can be done is as follows:
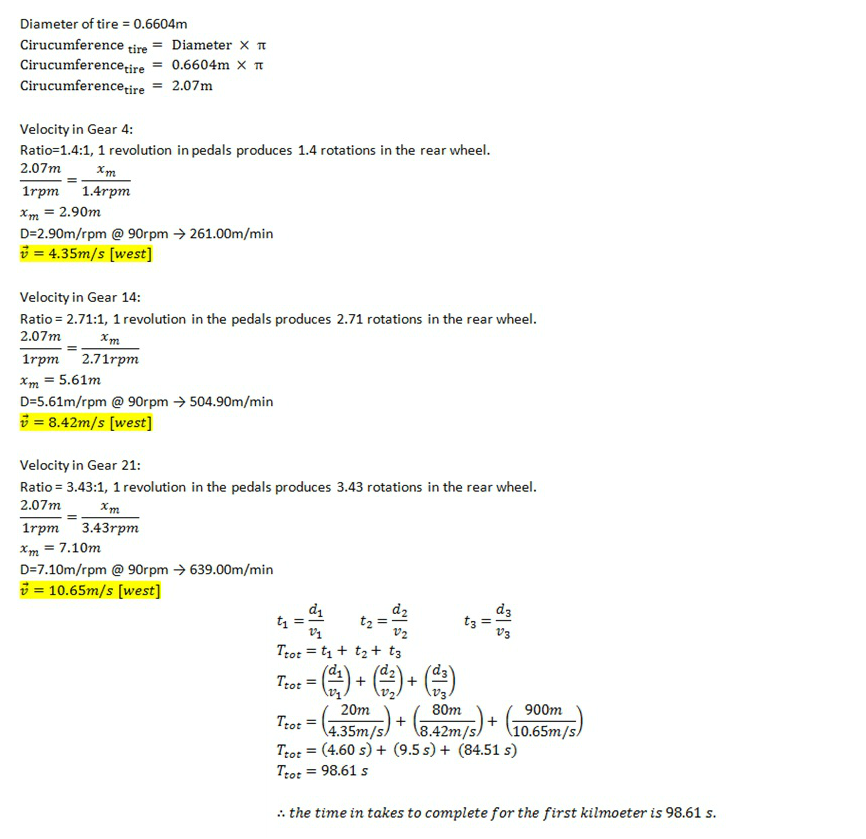
A racer wants to analyze the first kilometer of their race which is all level ground. They believe that the average pedaling cadence should be approximately 90 revolutions per minute (rpm), using a 21 speed bike. For the first 20m, gear 4 is engaged to achieve a high acceleration to get the bike up to speed. For the next 80m, the bike should be engaged in gear 14 to carry out a rapid acceleration as well as beginning to maintain a top speed. For the rest of the kilometer, the bike will be engaged in gear 21 to maintain its top speed. Calculate the time it takes to complete the first kilometer. (Diameter of tire = 0.6604m, race is in westward direction, refer to gear ratio chart at the bottom of this page).
A racer wants to analyze the first kilometer of their race which is all level ground. They believe that the average pedaling cadence should be approximately 90 revolutions per minute (rpm), using a 21 speed bike. For the first 20m, gear 4 is engaged to achieve a high acceleration to get the bike up to speed. For the next 80m, the bike should be engaged in gear 14 to carry out a rapid acceleration as well as beginning to maintain a top speed. For the rest of the kilometer, the bike will be engaged in gear 21 to maintain its top speed. Calculate the time it takes to complete the first kilometer. (Diameter of tire = 0.6604m, race is in westward direction, refer to gear ratio chart at the bottom of this page).
analysis of the beginning of a race
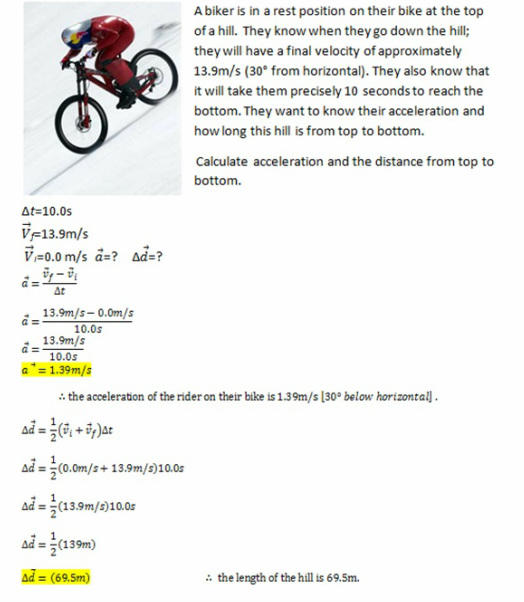
Scenario of a bike going downhill
Gear ratio for 21-speed bike
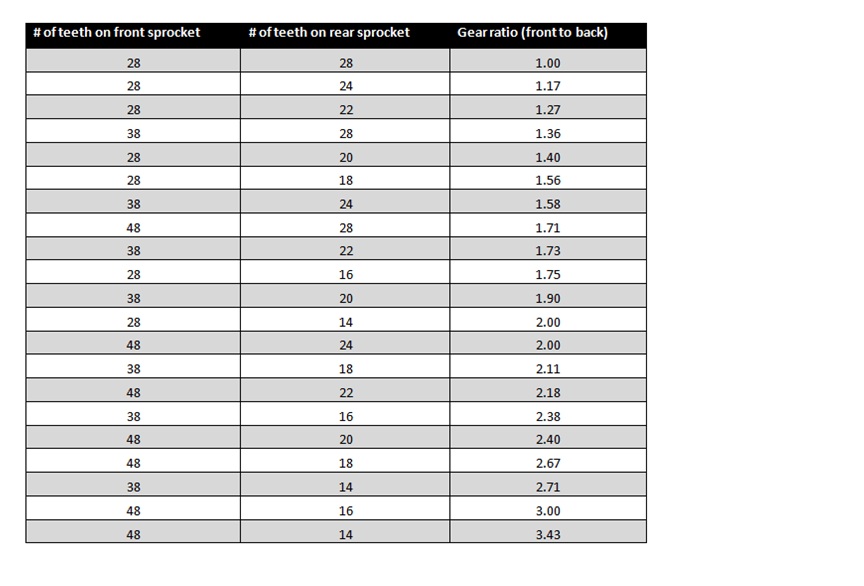
Mountain bikes have a variety of gear ratios as displaced in the above chart. The smallest gear ratio is one which means there is one revolution of the tire per one revolution of the pedals. The highest gear ratio is 3.43 which means that the rear tire goes the 3.43 revolutions per one revolution of the pedals.
Gear ratios determine speed and torque
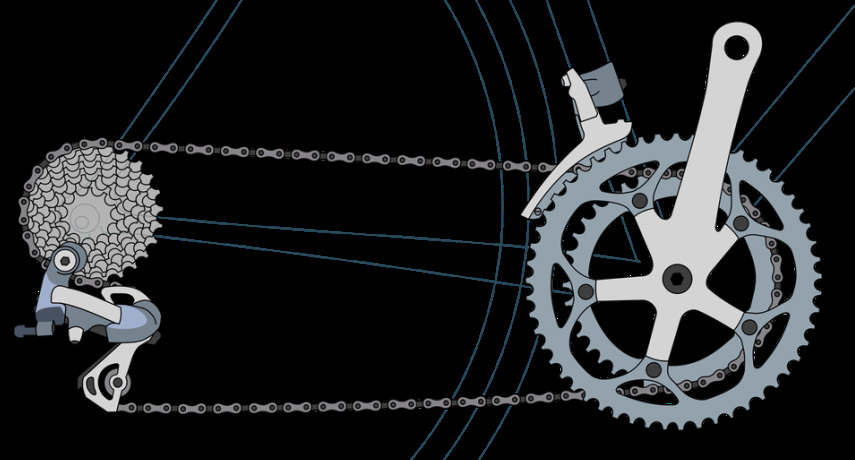
Bicycles involve a force being applied around a rotational point. When there is force around a rotational point, there is a term known as torque which is the amount force applied times the length of the moment arm (distance from applied force to pivot point). As you can see of the diagram of the gear system, the bike is in a low gear. This is demonstrated because the chain in front is on the smallest sprocket and its on the largest sprocket in the rear, thus producing a small gear ratio. Since the rear is in the largest sprocket, there is more torque generated while the same force is applied. This is because when the gear is larger, it has a longer moment arm which increase the amount of torque. As the gear ratio increases and the rear sprocket gets smaller, the amount of torque decreases because of the shorter moment arm. From this, the level of speed increases because the rear wheel will spin more rapidly per every rotation in the pedals. This enables the rider to cover more distance in a shorter amount of time.
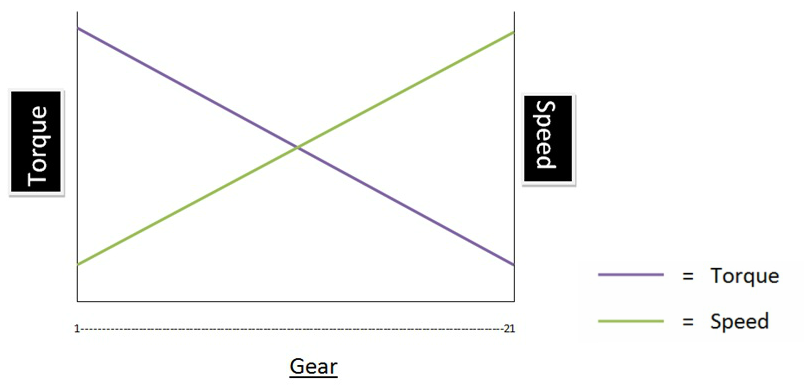
As you can see of the from the visual representation of the torque/speed graph, the torque and speed have an inverse relationship. As you increase the gear ratio (higher gear number), the speed of the rear tire begins to increase rapidly. The opposite happens with the torque; higher gear ratio means there is less torque in the rear tire.
